Which of the following graphs best represents the curve with equation in the range (excluding points where is undefined)?
A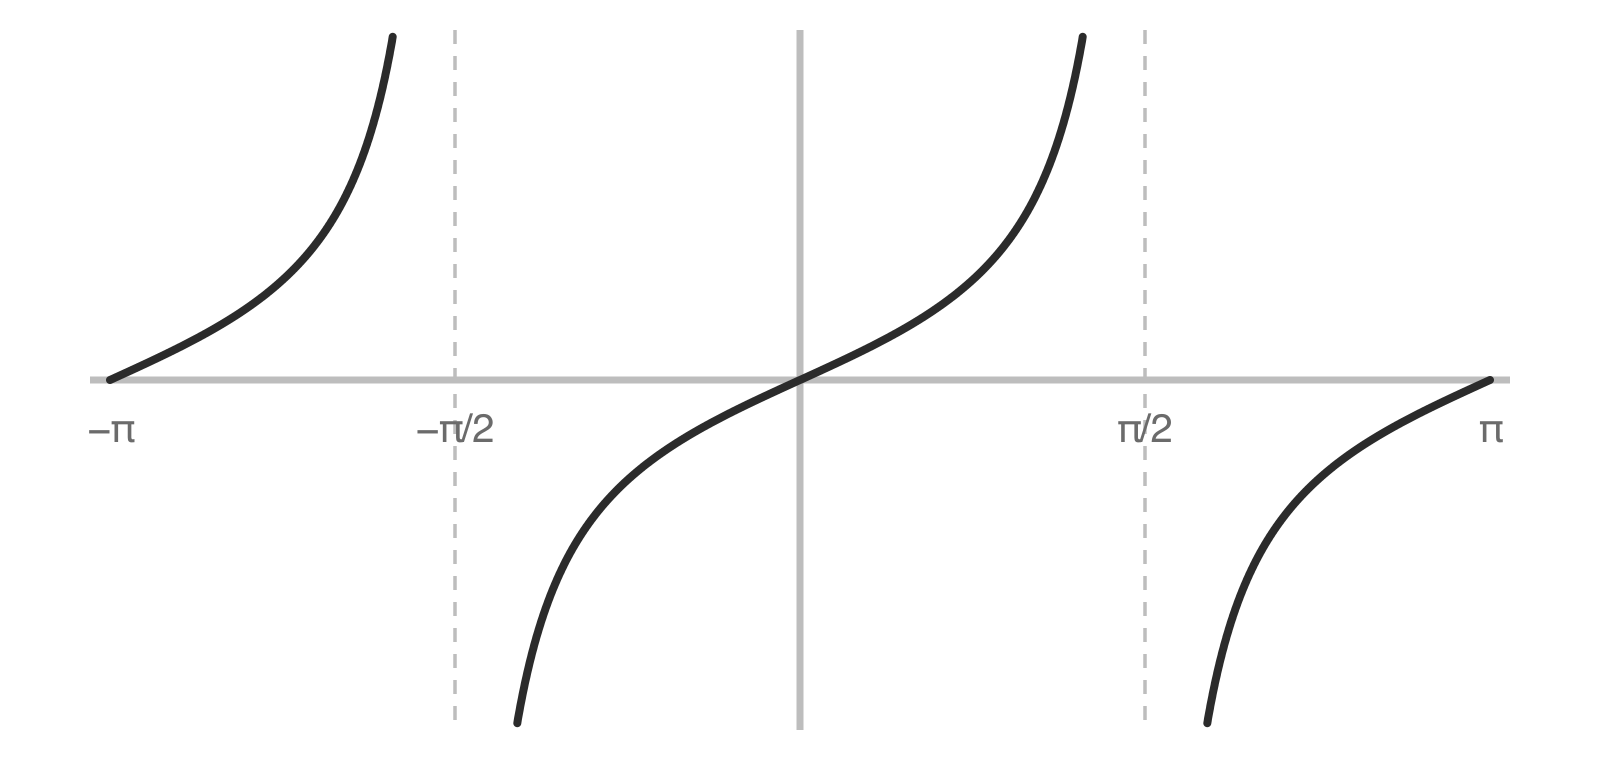
B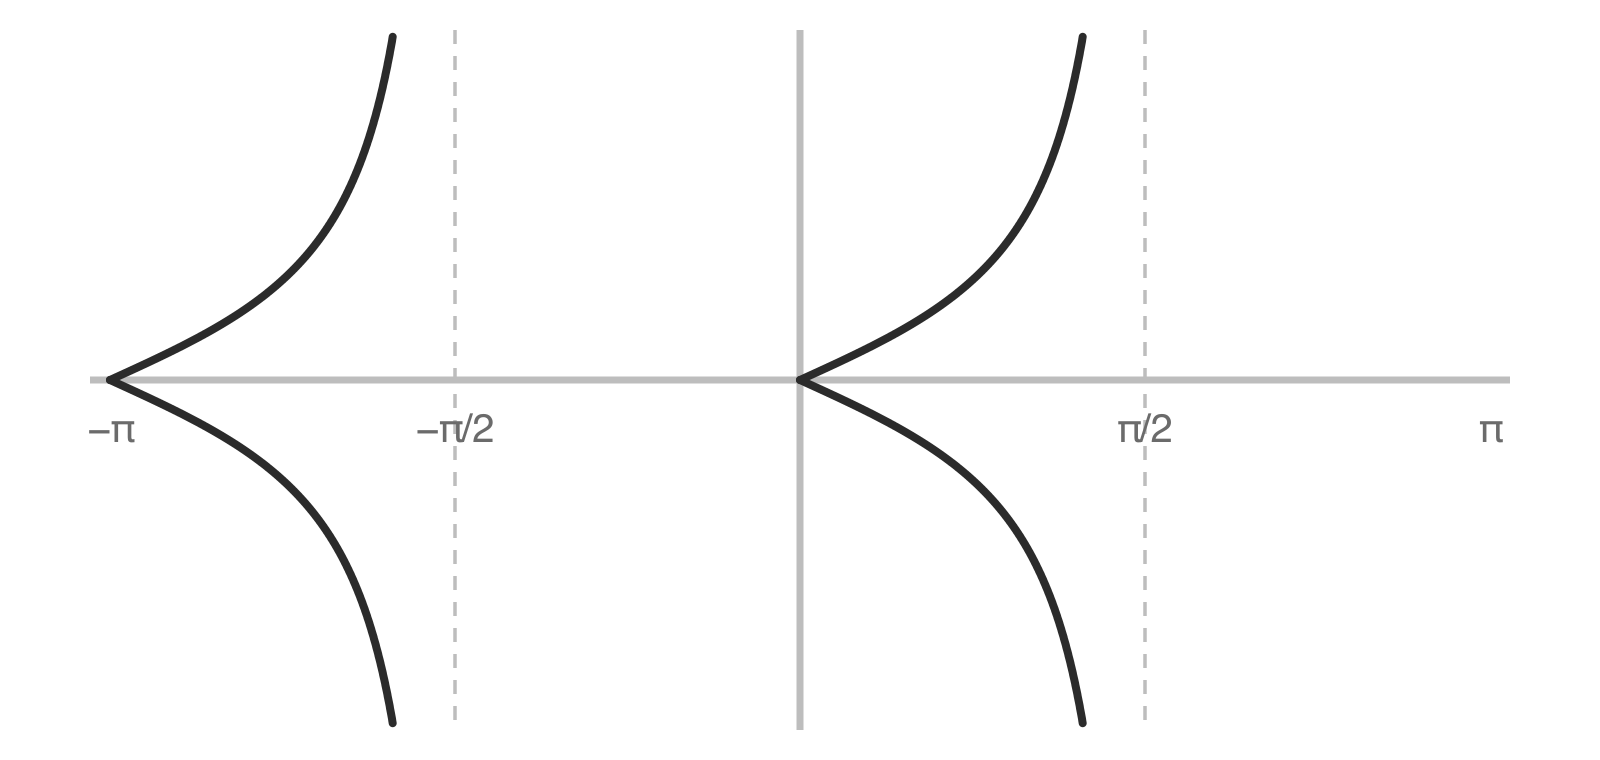
C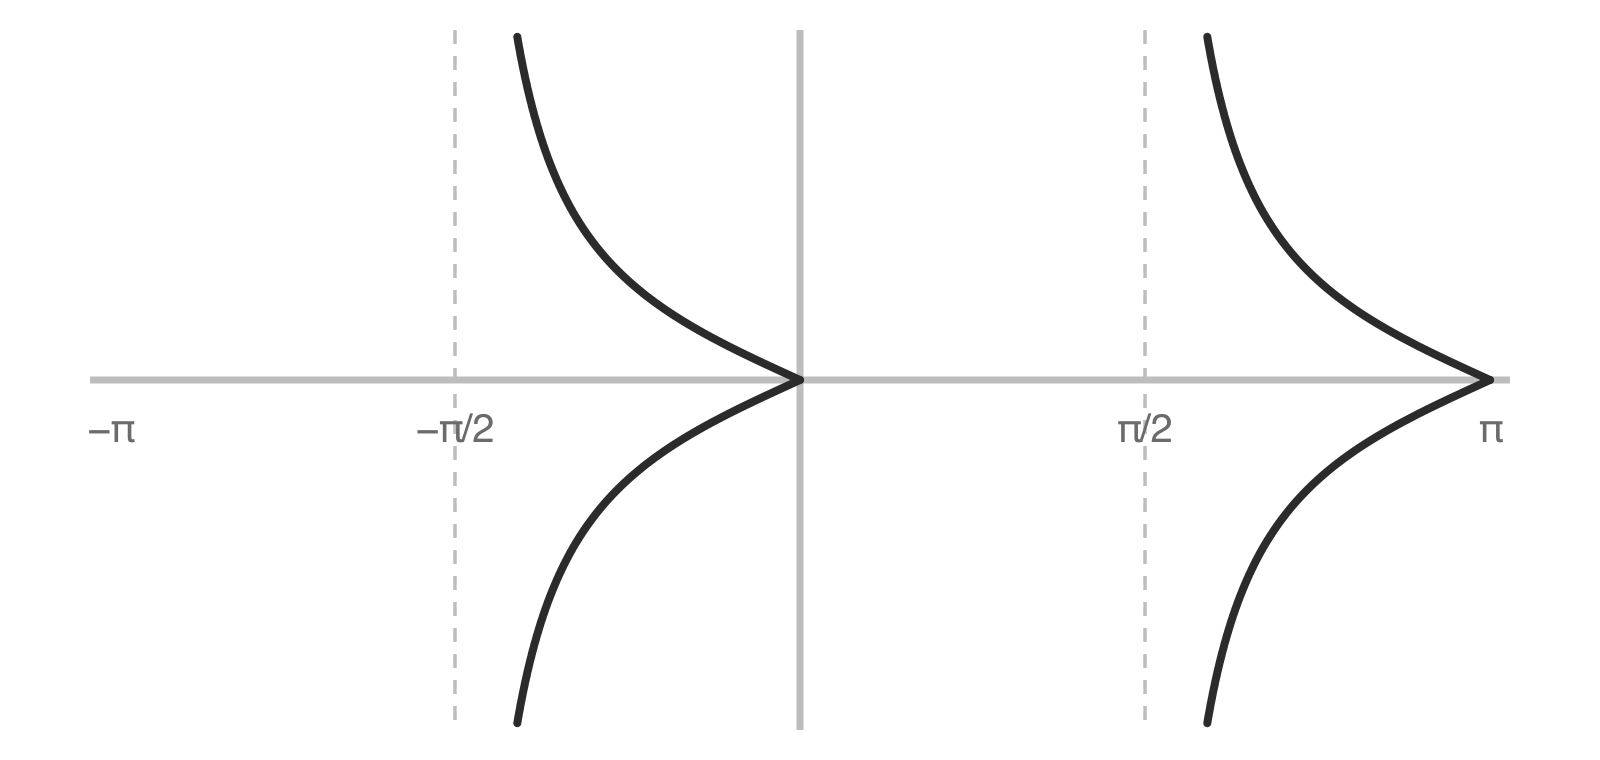
D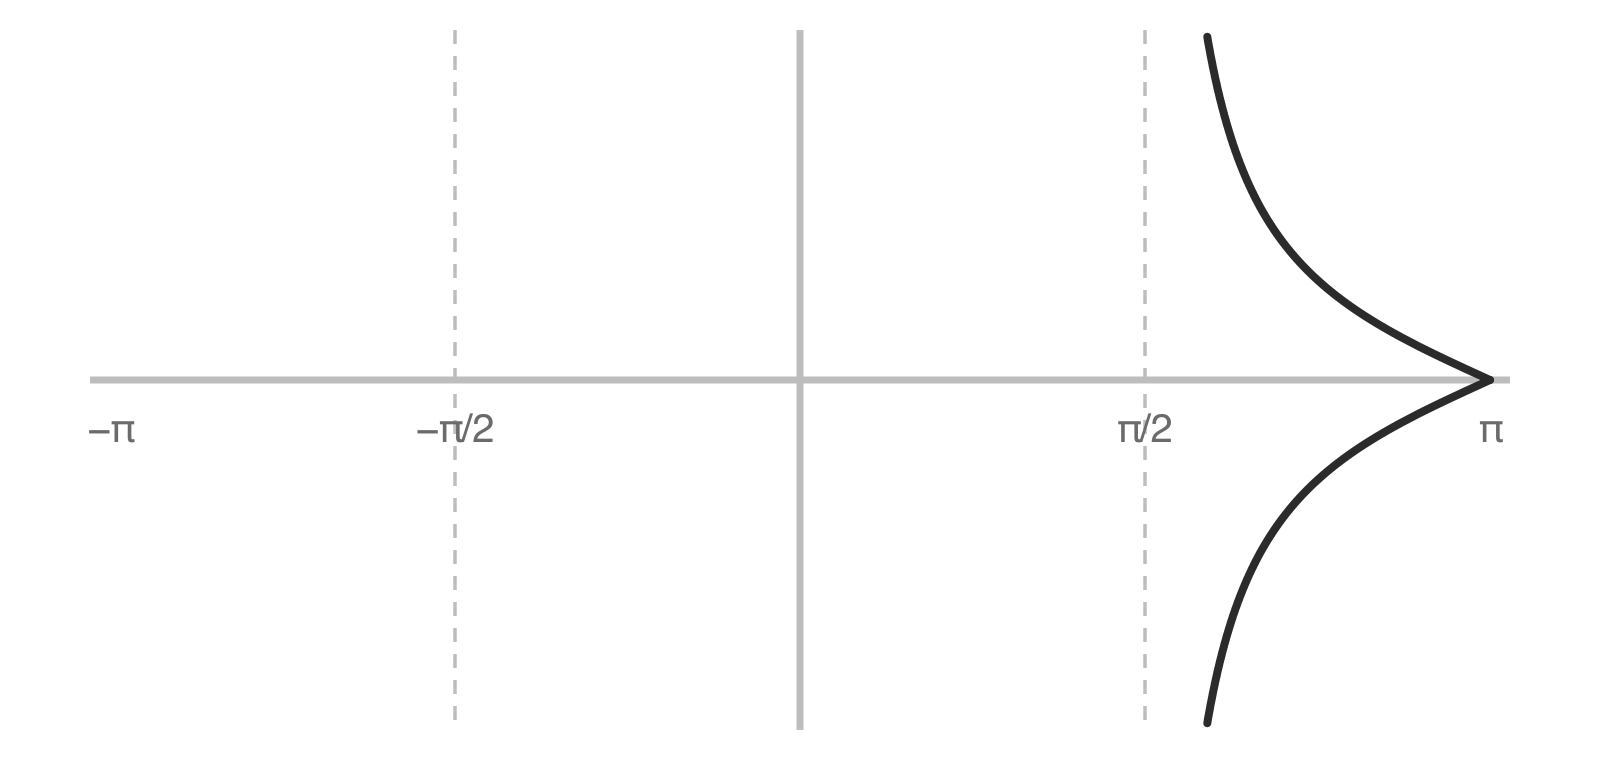
E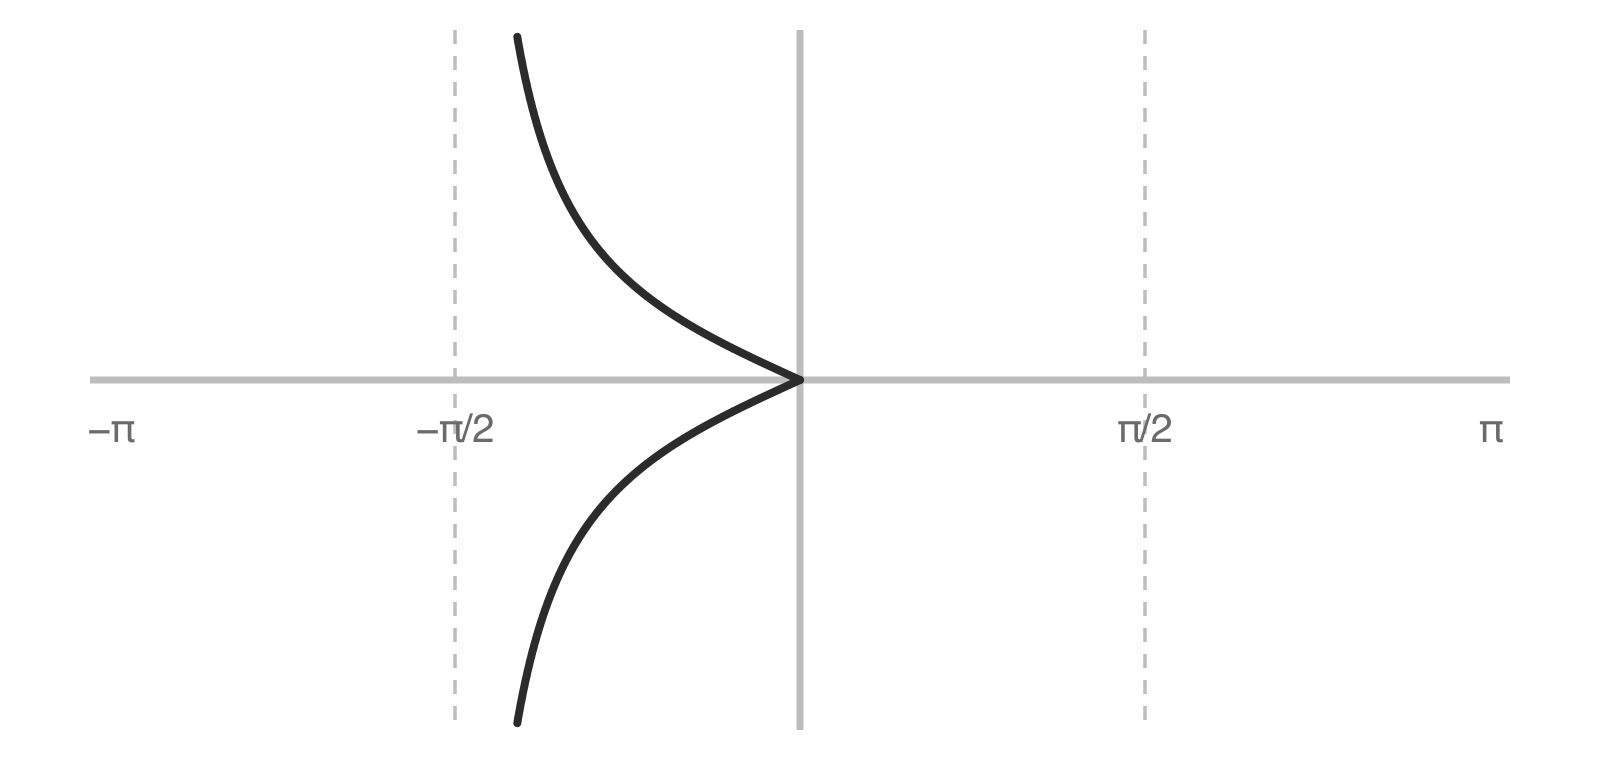
F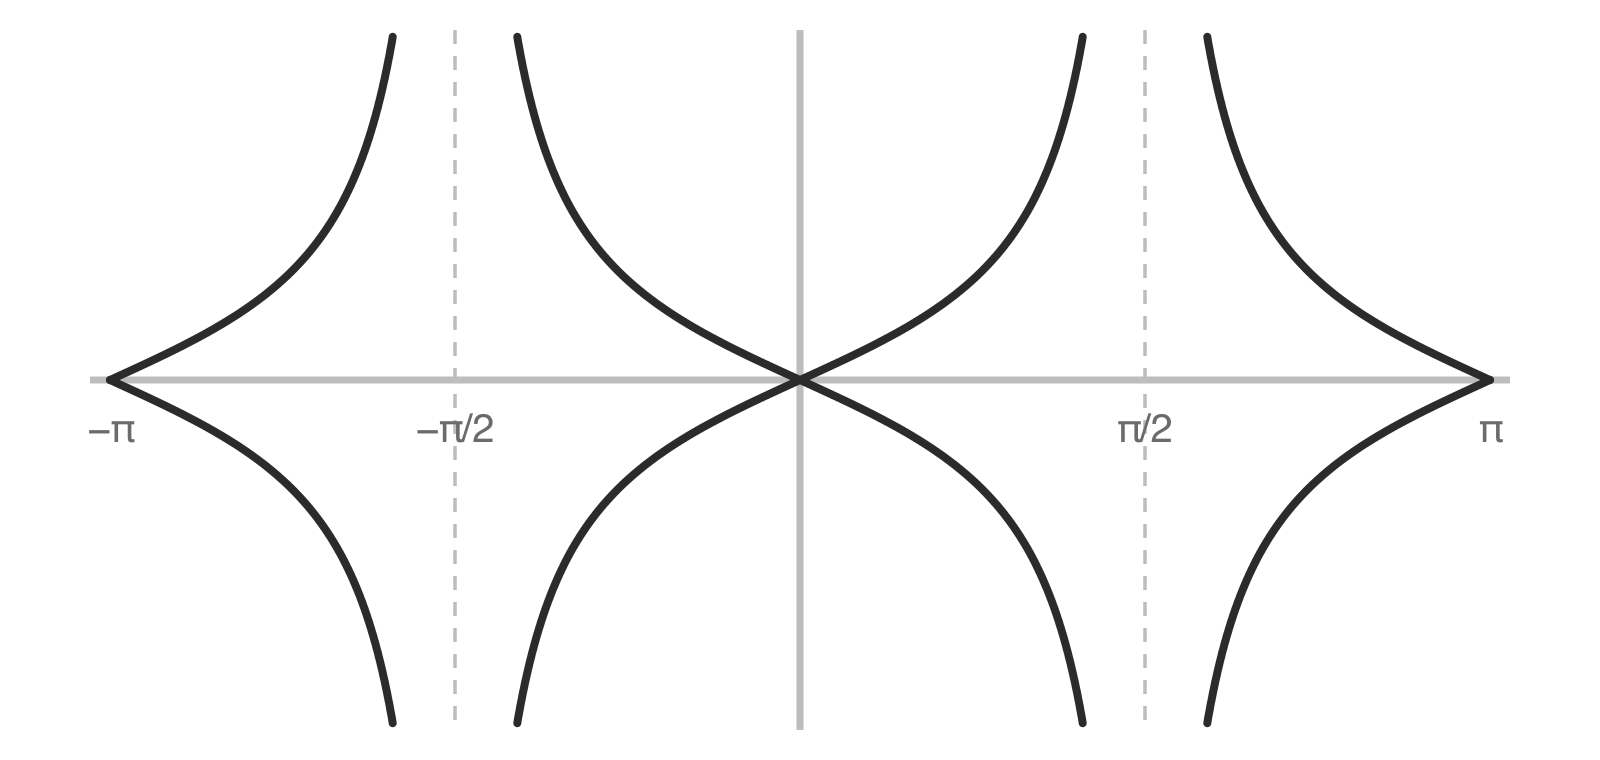
Which of the following graphs best represents the curve with equation in the range (excluding points where is undefined)?
Read the questions freely. Sign in to check your answer, see the worked solution and save your progress.