The graph of the quadratic
where , intersects the -axis at two distinct points.
In which one of the following graphs does the shaded region show the complete set of possible values that and could take?
A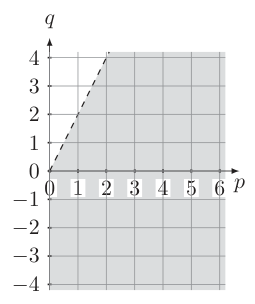
B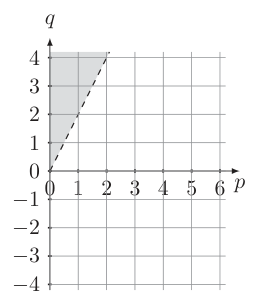
C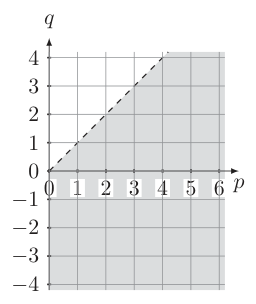
D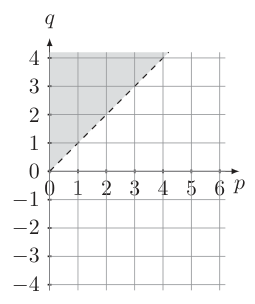
E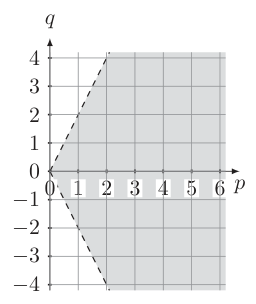
F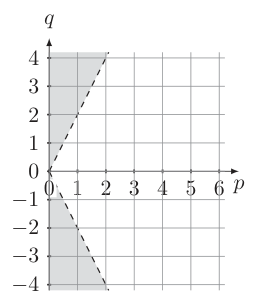
G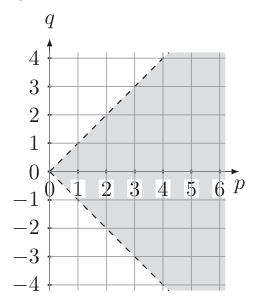
H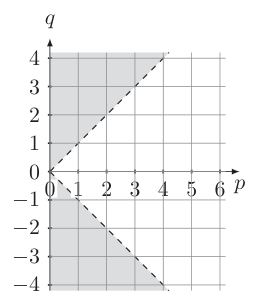
The graph of the quadratic
where , intersects the -axis at two distinct points.
In which one of the following graphs does the shaded region show the complete set of possible values that and could take?
Read the questions freely. Sign in to check your answer, see the worked solution and save your progress.